GLOBAL PEACE INDEX 2026
The world is less peaceful — for the 12th year running.
Global peacefulness declined by 0.7% over the past year, marking the 12th consecutive annual deterioration and the 15th decline in the last 18 years.
Three structural drivers underpin this trend: a redistribution of global power eroding the post-Cold-War order, the transnational spread of conflict through refugees, arms, finance and ideology, and the rapid diffusion of autonomous weapons and AI-enabled targeting ahead of governance frameworks.
Trends in Global Peacefulness
Source: IEP, Global Peace Index 2026.
The year in numbers
CHAPTER 01 · THE STATE OF PEACE
Global Peace Index 2026 Rankings
Iceland remains the most peaceful country in the world, a position it has held for 19 consecutive years, followed by New Zealand, Switzerland, Slovenia, and Ireland. For the first time, Russia ranks as the least peaceful country, followed by Sudan, the Democratic Republic of Congo, Ukraine, and Israel.
South Asia recorded the largest deterioration in the 2026 Index, driven by declines in Nepal, India and Pakistan.
Use the controls below to move between domains, drill into any of the 23 underlying indicators, and rewind the picture year by year back to 2008.
Source: IEP, Global Peace Index 2026. Map: Natural Earth.
CHAPTER 02 · A SHIFTING WORLD ORDER
The Great Fragmentation.
The international system is undergoing a structural transformation.
While US–China rivalry dominates headlines, a broader structural change is underway: the rise of middle powers and the growing influence of emerging economies across the Middle East, Asia-Pacific, and Latin America. This reflects a fundamental redistribution of global influence away from the traditional great powers of Europe.
The Great Power Decline.
The relative influence of traditional great powers has been in steady decline over the past three decades. With the exception of Russia and India, major European economies now account for a smaller share of global GDP than they did at the end of the Cold War.
A more economically distributed world is a less coercible one: sanctions cost more to enforce, and alternative payment systems and supply chains keep getting more credible.
Source: IEP / World Bank.
Geopolitical risks exceed levels of the Cold War, driven by heightened military spending, the diminished role of multilateral institutions, the tripling of trade restrictions, and increasing competition among major and middle powers.
CHAPTER 03 · ECONOMIC IMPACT OF VIOLENCE
Violence cost the global economy US$21.8 trillion in 2025.
+3.2% year-on-year
Violence and the fear of violence create significant economic disruptions.
The consequences amount to considerable direct and indirect costs that erode economic development, increase instability and deepen inequality.
Where the $21.8 trillion goes
Hover a slice or legend item for details · Source: IEP, GPI 2026.
- Military expenditure43.3%
- Internal security expenditure29.1%
- Other8.3%
- Private security7.0%
- Homicide3.6%
- Suicide3.6%
- Veteran affairs3.4%
Military and internal security systems drive 73% of the cost of violence. Peacebuilding receives just 0.5% of global military spending.
0.5% of military spend
INTERACTIVE · THE HIDDEN PRICE OF THE IRAN WAR
Worth US$2.2 trillion to prevent.
Successful diplomacy that prevents the war in Iran from restarting would be worth approximately US$2.2 trillion to the global economy. Select a scenario to see how each pathway compares with the largest economic shocks of the past two decades.
Selected scenario vs major historical shocks · percentage points.
Source: IMF WEO, Federal Reserve Board, Brookings, IEP Calculations.
- Partial reopening of Strait of Hormuz
- Continued naval harassment
- Elevated shipping risk premiums
- Persistent but contained disruption
“Global impact is moderate in aggregate but unevenly distributed across regions and income groups.”
CHAPTER 04 · THE RISE AND SPREAD OF CONFLICT
The Rise and Spread of Conflict
Internationalised intrastate conflicts have increased by 175% since 2010. This new era of warfare is defined by overlapping conflict systems, in which localised wars are no longer isolated but instead feed into broader regional instability through political, economic and military linkages, as well as refugee flows.
Prominent conflicts over the past decade, including those in Sudan, Ethiopia and across the Sahel, are no longer self-contained domestic crises. Understanding modern warfare increasingly means understanding how these connections operate across borders.
Three structural shifts driving conflict diffusion
Countries involved in external conflict — the highest level since World War II.
Decline in conflicts ending through peace agreements over the past 60 years.
Increase in drone attacks between 2018 and 2025. New technologies are lowering the barriers to participation.
These dynamics are increasingly fuelled by self-financing, illicit economies. The production value of illicit drug economies in five major conflict-affected states more than quadrupled between 2015 and 2024, rising from US$14 billion to US$59 billion.
Estimated Production/Export Value (USD Billions). Source: UNODC World Drug Reports; DEA NDTAs; Carnegie Endowment; New Lines Institute.
HOW CONFLICT SPREADS
Mechanisms of conflict spread
IEP’s framework groups nine diffusion mechanisms into three categories. Conflict spreads through two active channels — material and relational — operating within a broader set of conditioning factors that shape vulnerability.
These factors move people, weapons, money and fighters across borders.
- 01Refugee and displacement flows
- 02Arms and combatant circulation
- 03Illicit economies
- 04Rebel sanctuaries
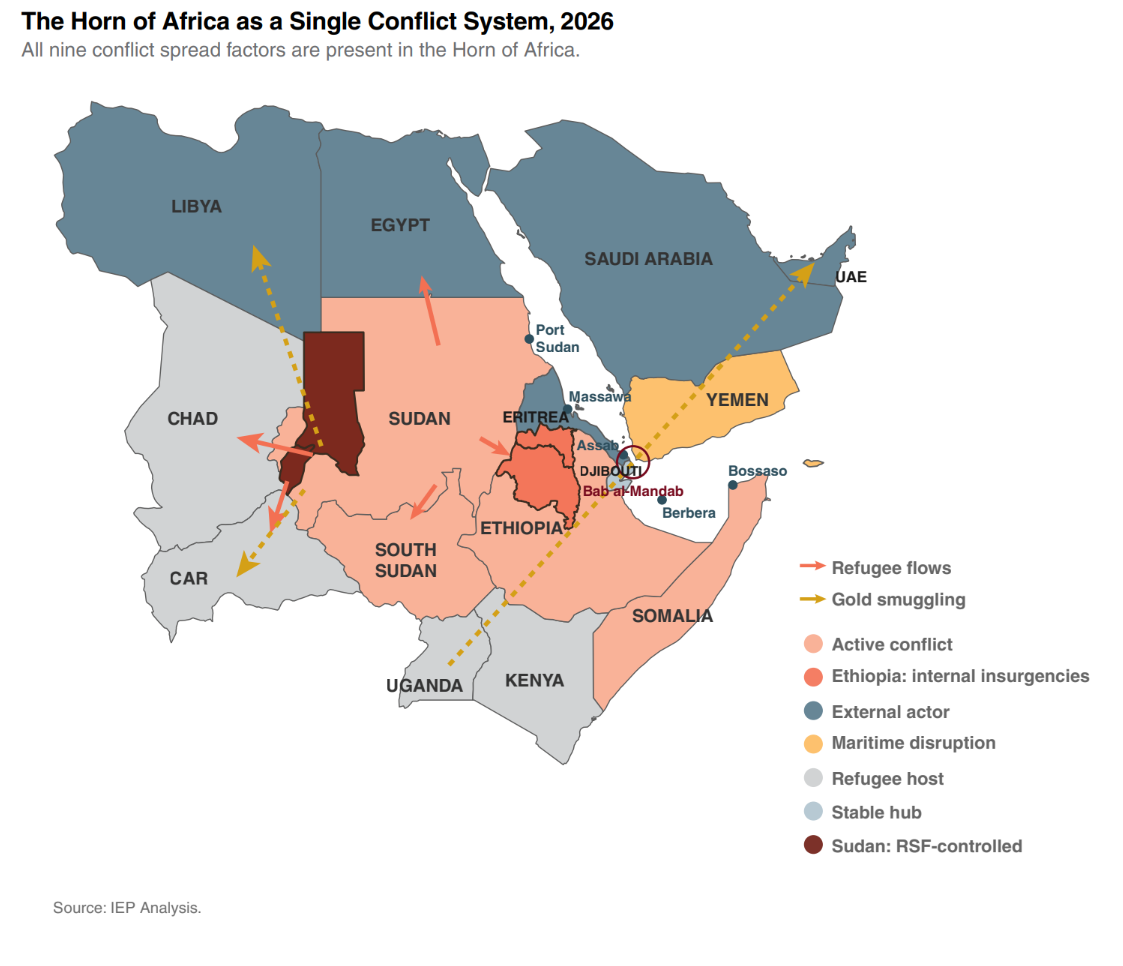
IN FOCUS
The Horn of Africa: conflict spread as a regional system.
The Horn of Africa, comprising Sudan, Ethiopia, Eritrea, Somalia, Djibouti and South Sudan, is the clearest example of all nine conflict diffusion mechanisms operating at the same time.
CHAPTER 05 · AI, CONFLICT & PEACE
Artificial intelligence is reshaping how peace and conflict are waged, observed, and analysed.
In this environment, Positive Peace — the attitudes, institutions, and structures that sustain peaceful societies — becomes both more important and harder to build, as technologies of conflict diffuse faster than the institutions of peace.
In the past year, there were more than 60 active state-based conflicts, thousands of terrorist attacks, and over 180,000 people killed in conflict, with drone use expanding across both state and non-state actors. The same period also saw rapid growth in the use of AI for mediation support, atrocity documentation, humanitarian translation, and conflict early warning.
TWO TRAJECTORIES
Two trajectories are unfolding simultaneously.
AI is compressing the kill chain, lowering the marginal cost of lethality, and concentrating compute and capital within a small number of firms and states.
Drone strikes are now a routine instrument of war.
ACLED logged a roughly hundred-fold increase in recorded drone-strike events between 2018 and 2025. Ukraine accounts for most of the rise, but events outside Ukraine have also risen sharply — from Yemen to Myanmar to the Sahel.
Source: ACLED, IEP calculations
The decision loop is collapsing from days to seconds.
Target-to-fire time across six representative systems, logarithmic scale.
- Cold War cruise-missile planning cycle1d
- JDAM, satellite-cued precision strike1h
- GIS Arta networked artillery (Ukraine)20m
- GIS Arta with AI-cued sensor fusion (Ukraine)1m
- IDF Lavender human review window20s
- V2U autonomous terminal selection5s
Both trajectories are accelerating, but they remain uneven. Infrastructure for AI-enabled military applications is already operational and scaling, while infrastructure for AI-enabled peace remains fragmented, underfunded, and largely uncoordinated.
CONCENTRATION & THE GOVERNANCE GAP
Rapid Concentration of AI Capability in a Small Number of Actors
In 2024, private AI investment reached US$109 billion in the United States, compared with US$9.3 billion in China and US$4.5 billion in the United Kingdom. Inference costs fell from ~US$20 per million tokens in 2022 to ~US$0.07 by late 2024 — enabling rapid global deployment while training capacity stays concentrated among a handful of actors.
Source: Stanford AI Index 2025.
Source: Stanford AI Index 2025, Epoch AI, Ireland Central Statistics Office, IEP analysis
A widening mismatch between AI system scale and regulatory development
The international response to AI’s emerging warfare applications has not yet settled into a coherent legal framework. Since 2023, seven major multilateral initiatives — including the Bletchley Declaration, the Seoul AI Summit outcomes, the Hiroshima AI Process, and the REAIM Call to Action — have attempted to establish norms for military and frontier AI. Of 171 states tracked, 90 have not signed any of them.
- Bletchley Declaration · 202330 / 171
- Seoul Declaration · 202428 / 171
- Paris AI Action Summit · 202561 / 171
- CoE Framework Convention CETS225 · 202441 / 171
- REAIM Seoul Blueprint · 202461 / 171
- REAIM A Coruna Pathways · 202635 / 171
- US Political Declaration Military AI · 202353 / 171
Signatory counts compiled from public communiqués. Best-effort; users should cross-check against primary sources for any specific instrument.
This reflects a structural imbalance: participation is concentrated among a small group of technologically advanced states, while many countries most exposed to AI-related risks remain outside formal governance processes.
Further analysis
Read more on Vision Of Humanity →How terror groups are now using AI to improve attacks
Terror groups had been using artificial intelligence mainly as a propaganda tool. New research suggests AI is now being used across an entire attack chain.
AI Cold War: New Chapter of Great Power Competition?
Massive infrastructure investments in artificial intelligence are changing the nature of power in the 21st century and reshaping global alliances.
How Football Carries the Stories Conflict Leaves Behind
Around a quarter of the 1,248 players at the 2026 World Cup were born outside the country they represent — the highest proportion ever recorded at a men's World Cup.
DOWNLOAD
Take the report with you.
Institute for Economics & Peace. Global Peace Index 2026: Measuring Peace in a Complex World, Sydney, June 2026.